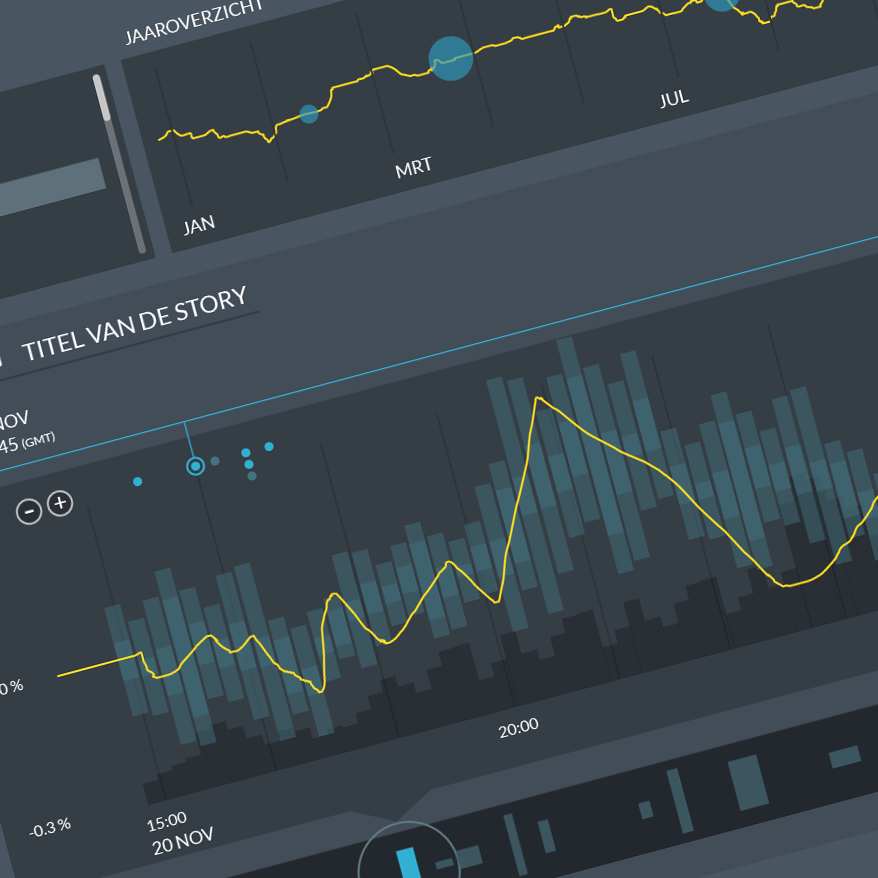
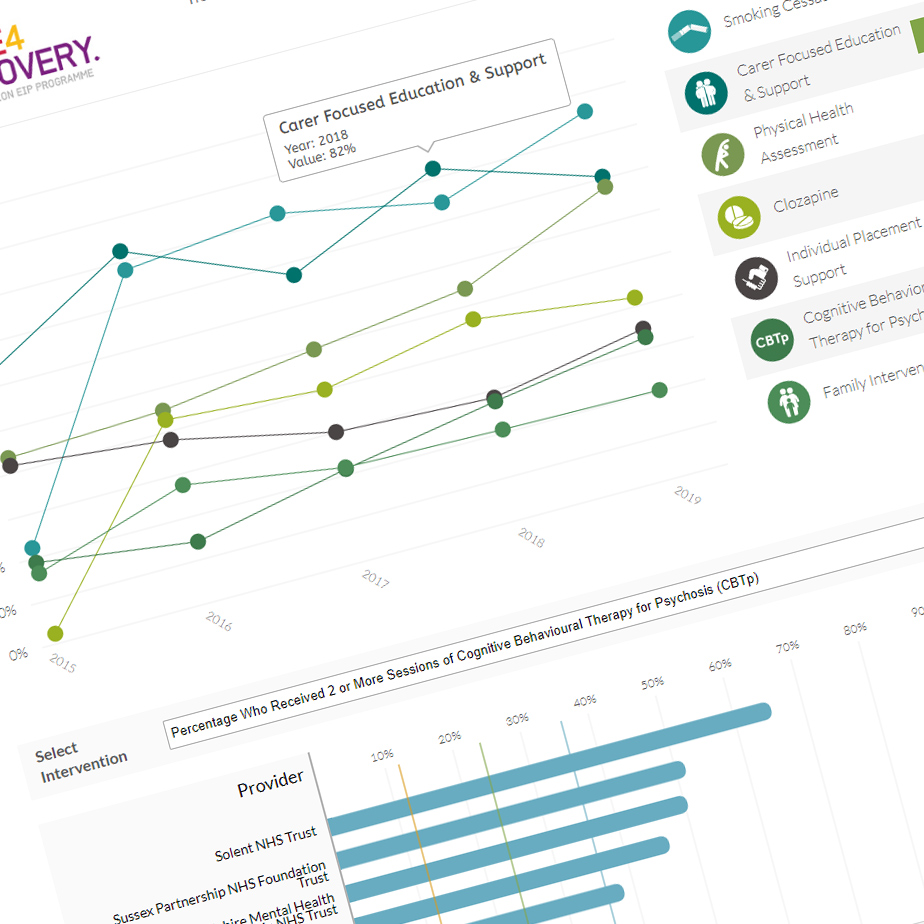
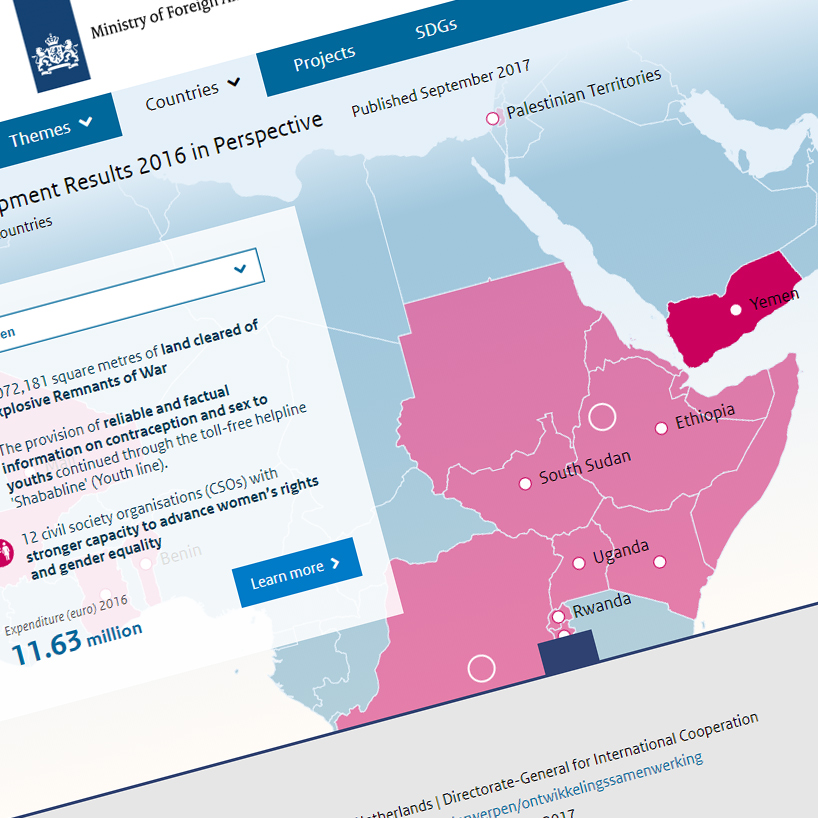
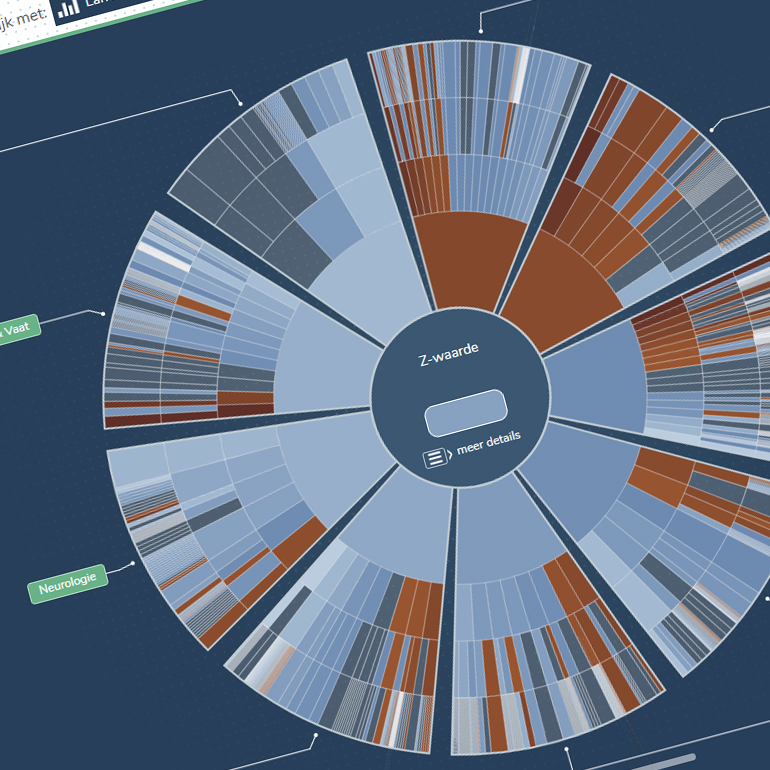
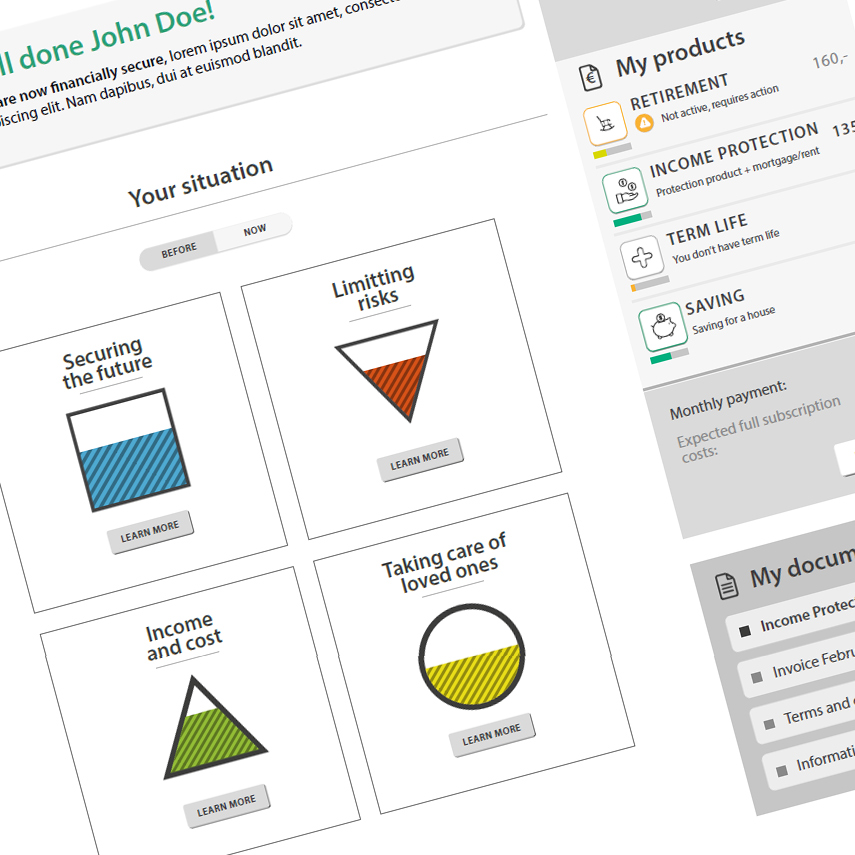
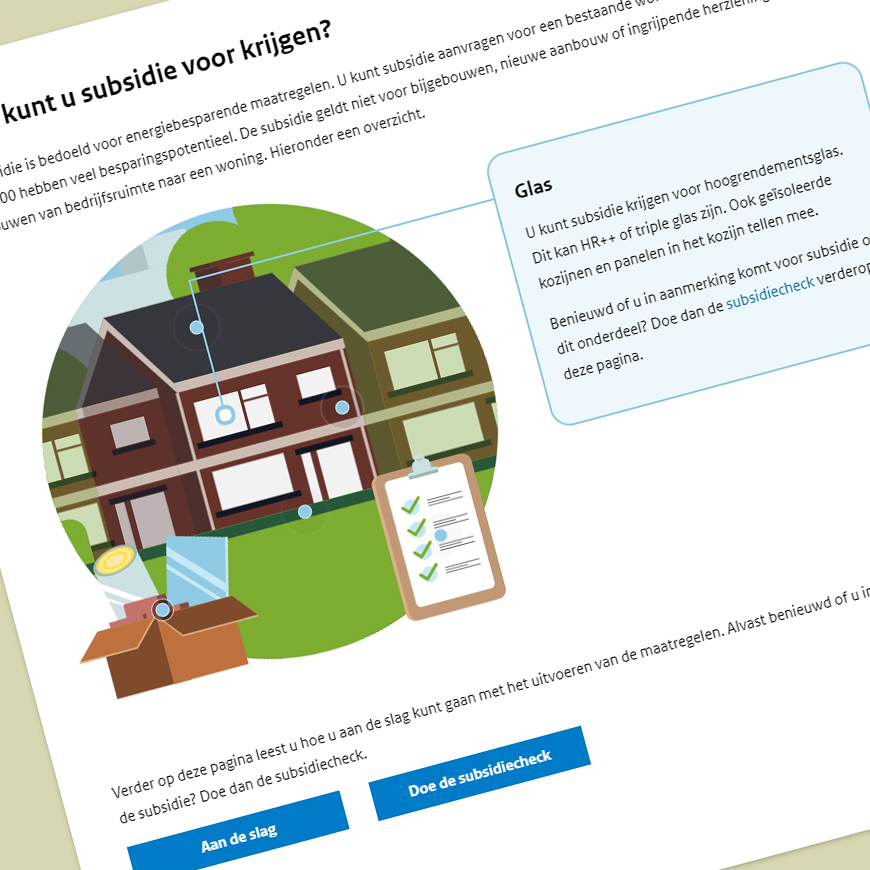
Whether you have a single excel sheet, or a complex database, we will turn it into a framework that’s visually appealing, accessible and easy to understand. We do this by creating tailor made user interfaces (UI) and data visualizations. Tools that make it easy for you to explore your data from different perspectives, and to gain a deeper understanding of what is important.
Our work
We help public services report on their activities and companies gain more insights in their supply chain. We create actionable dashboards for organizations that need to share more than numbers with their employees, without burdening them with thick reports. We aid banks in providing customers with greater insights into their financial situation and we build interactive infographics for marketeers who want to go the extra mile.


